Virtana OpsCruise
Address the operational and performance challenges of dynamic, orchestrated cloud applications that legacy monitoring tools are ill-suited to handle.
Book a Demo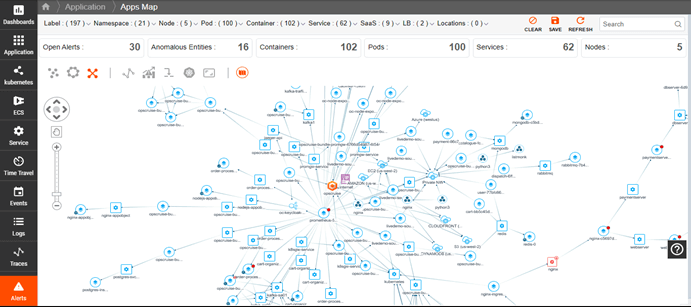
Actionable Observability for Kubernetes Environments
Virtana OpsCruise provides a complete view of your application and container environment for better insights into performance, dependencies, and overall system health for more informed decision-making and operational efficiency.
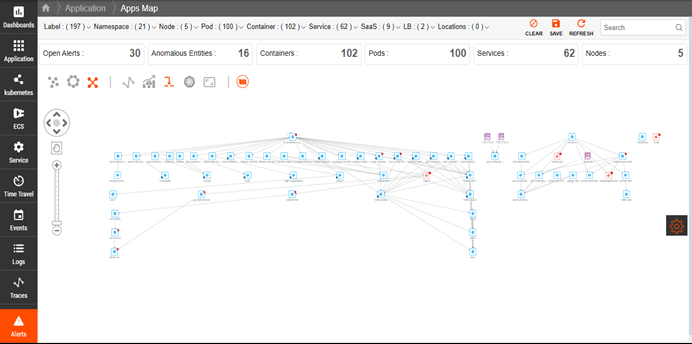
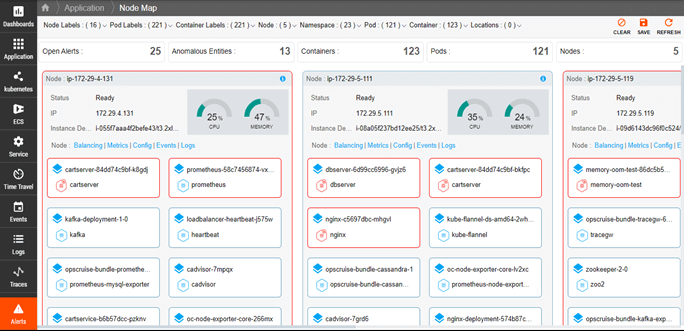
Kubernetes Dependency Maps
Understand the complex relationships and dependencies of a Kubernetes cluster to quickly identify issues, track resource changes, and monitor service performance.
- Automatically discover Kubernetes services and resources.
- Visualize dependencies within the cluster.
- Get a holistic view of the entire cluster.
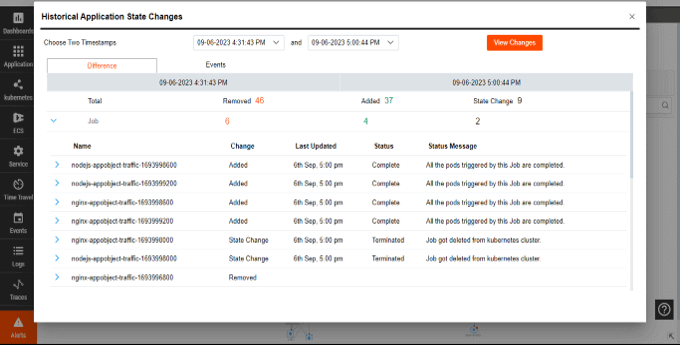
Time Travel
Empower your team to understand issues, identify root causes, refine processes, and prevent future incidents.
- Scroll back through time to see past changes and topology.
- Compare system states before and after changes.
- Conduct productive and blameless postmortems.
Early Anomaly Detection
Improve the efficiency of issue identification and resolution to reduce downtime and improve system reliability.
- Automatically detect critical errors and exceptions in log data.
- Leverage human-coached AI/ML for accurate detection.
- Focus on critical errors and exceptions.
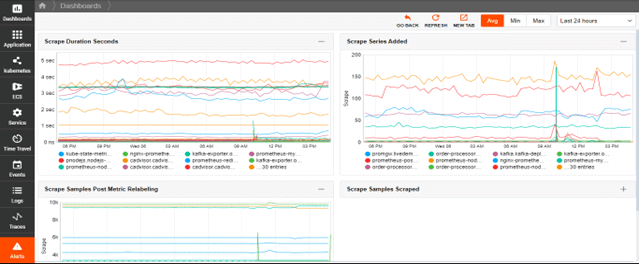
Metrics, Events, Logs, and Traces (MELT)
Get all the information you need to understand, manage, and optimize your environment.
- Automatically collect and retain key metrics, leveraging PromQL to make metric query-writing easy.
- Get a comprehensive, centralized view of events in your Kubernetes landscape, such as images pulled, containers started, or pods terminated due to memory constraints.
- Automate log collection, aggregation, analysis, and visualization to reveal vital information about resources in your cluster and eliminate the need for time-consuming command-line queries.
- Automatically derive golden signals—error rate, throughput, and latency—to monitor applications running on Kubernetes clusters, trace information to detect slow services, and optimize the customer experience.
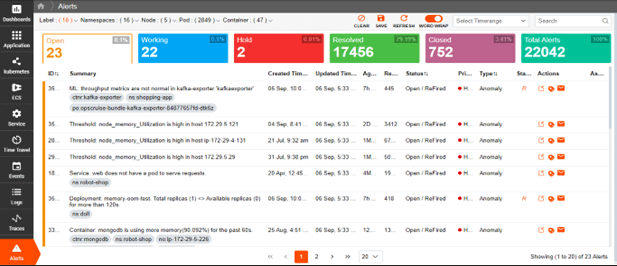
Real-Time Alerting and AI-Driven Recommendations
Promptly notify teams of potential issues for proactive mitigation, faster response times, reduced MTTR, and minimized operational disruptions.
- Create advanced alerts based on queries and conditions.
- Use customizable frequencies to prevent alert fatigue.
- Get alert recommendations with supervised machine learning.
- Integrate alerts with multiple notification channels.